It is constantly claimed that over half of the people in the US "pay no taxes." Although that IS the case when you look at federal income taxes (thanks to various tax credits and deductions), it's important to realize that 58.5% of total federal tax receipts come from other sources.
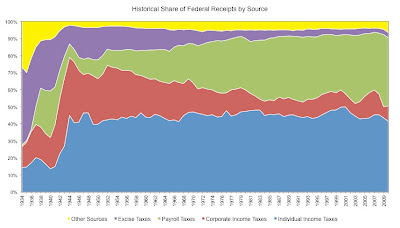
The 2 charts below show the current share of federal receipts by source compared to historical highs and lows as well as a visual representation of the distribution from 1934 to 2010.


What should be evident from the data is that although over half of the US pay no federal income taxes, EVERYONE pays payroll taxes (unless you make over $106,800, every dollar of which earned over that amount is payroll-tax free OR if you make your money from investment income, which is ironically called "unearned income"), which make up an almost identical share of total tax collections as federal income taxes (40% vs. 41.5%).
When you factor in the cap mentioned above, the poor and middle class pay a disproportionately large share of payroll taxes compared to the wealthy. So although the top 1% may pay 38% of all federal income taxes, they pay a much smaller share of payroll taxes.
The other important trend to notice is that the taxes on people (income and payroll taxes) are both near all time highs but those on business (corporate income taxes, excise taxes, and other) are all near all time lows.
Is it time for the pendulum to swing back in the other direction?
For reference:
- Payroll taxes are comprised of Social Security, Medicare, Disability, Unemployment, and other retirement/health insurance taxes
- Excise taxes are comprised of taxes on alcohol, tobacco, oil windfall profits, telephone, ozone depleting chemicals/products, transportation fuels, health insurance providers, indoor tanning services, medical devices
- Other taxes include Estate and Gift Taxes; Customs, Duties, and Fees; and other miscellaneous receipts


No comments:
Post a Comment